


click here for a larger or much larger slide
Notes:
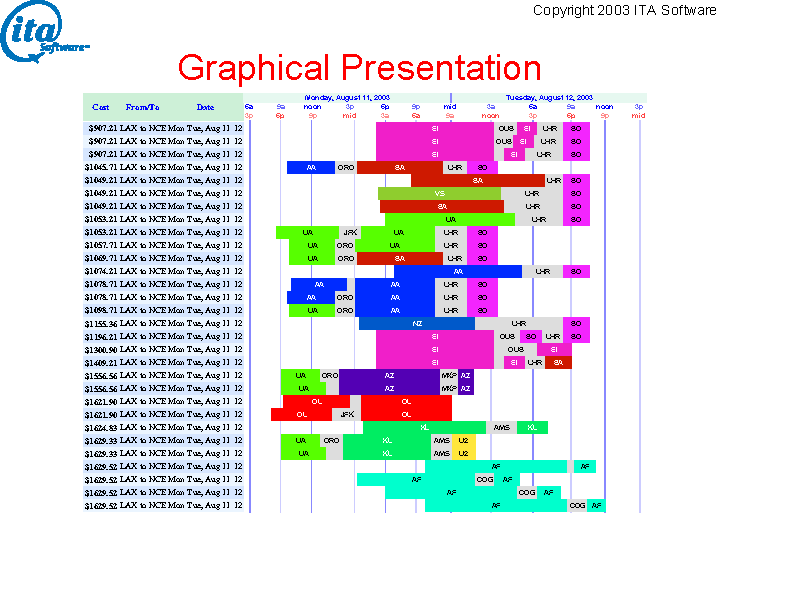
To help understand the upcoming slides, this figure shows a graphical presentation of a small set of solutions to a one-way Los Angeles (LAX) to Nice (NCE) query. Each row represents one possible itinerary from LAX to NCE. Time is laid out horizontally, with colored bars representing flights. A flight's airline determines the color of its bar. Layovers are represented by gray bars. When there is space airline and airport codes are written. This general format will be used to present solutions to queries, though in subsequent slides each trip will have several parts and thus be represented by several lines.
In the TM encoding used for these demos, a tape cell's contents, and the TM state if the head is over the cell, are represented by the airline of a flight. Thus, the configuration of the tape can be read from the sequence of bar colors.